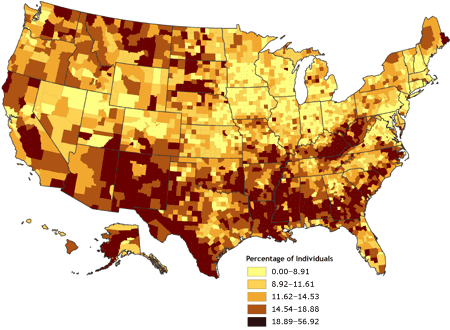
Univariate choropleth map indicates only one specific set of data. In this case polulation. This map shows a percentage of individuals in different age groups that are experiencing proverty in the United States.
URL: http://www.cdc.gov/pcd/issues/2007/oct/images/07_0091_02.gif

No comments:
Post a Comment